
Chapter 10: Unsupervised Learning, K-Means and Hierarchical Clustering
In supervised learning we trained our model using labeled data, but what if we don’t have labels, what if we just want to explore, group, and summarize patterns in our raw data. This is where the importance of unsupervised learning comes into play. In this chapter we will explore the logic behind clustering, two important clustering techniques in K-Means Clustering and Hierarchical Clustering, real world uses for these techniques, and their python implementations.
10.1 K-Means Clustering
K-Means is one of the most popular clustering algorithms. It partitions your data into K distinct, non-overlapping groups based on similarity.
How it works:
- You choose the number of clusters, k
- The algorithm places k centroids (center points) randomly
- It assigns each data point to the nearest centroid
- It then recalculates each centroid as the average of all points in its cluster
- Repeat until the assignments stop changing
Why it works: It’s based on a simple, intuitive principle: group data points by minimizing the distance to their group center. It uses an iterative process to refine those groupings.
Where it’s used:
- Customer segmentation
- Image compression
- Grouping behaviors (users, events, purchases)
- Finding structure in unlabeled datasets
Where it struggles:
- Choosing the right number of clusters k
- Sensitive to outliers and initialization
- Doesn’t work well with non-spherical clusters
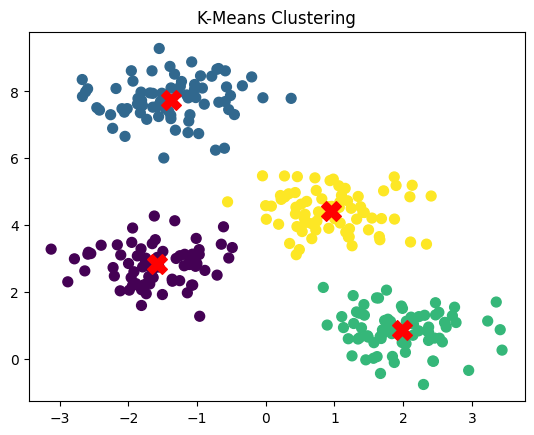
K-Means in Python
from sklearn.cluster import KMeans
from sklearn.datasets import make_blobs
import matplotlib.pyplot as plt

X, _ = make_blobs(n_samples=300, centers=4, cluster_std=0.60, random_state=0)

kmeans = KMeans(n_clusters=4)
kmeans.fit(X)

plt.scatter(X[:, 0], X[:, 1], s=50, c=kmeans.labels_, cmap='viridis')
plt.scatter(kmeans.cluster_centers_[:, 0], kmeans.cluster_centers_[:, 1], s=200, c='red', marker='X')
plt.title("K-Means Clustering")
plt.show()
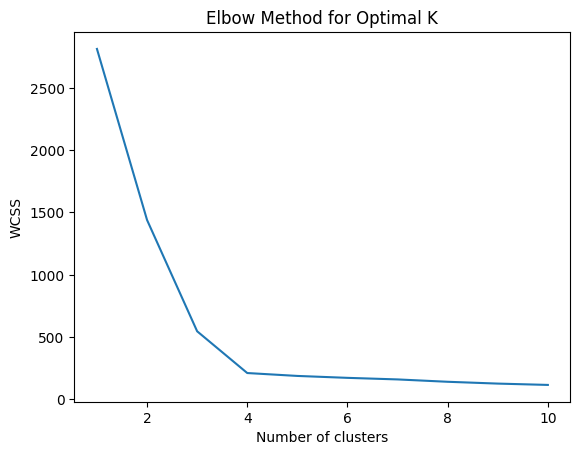
10.2 Finding the Right Number of Clusters: The Elbow Method
Try different values of k, and plot the within-cluster sum of squares (WCSS) for each. WCSS = total distance of points from their cluster center. Look for the “elbow” point where adding more clusters doesn’t improve much.
wcss = []
for i in range(1, 11):
    kmeans = KMeans(n_clusters=i)
    kmeans.fit(X)
    wcss.append(kmeans.inertia_)
plt.plot(range(1, 11), wcss)
plt.xlabel('Number of clusters')
plt.ylabel('WCSS')
plt.title("Elbow Method for Optimal K")
plt.show()
10.3 Hierarchical Clustering
Hierarchical clustering builds a tree of clusters, where each level represents a different granularity.
There are two main types:
- Agglomerative: Start with each point as its own cluster, and merge them step-by-step.
- Divisive: Start with all points in one cluster and split them recursively.
We’ll focus on agglomerative clustering, the most common.
Why it works: It builds a visual summary of relationships between all points. You don’t have to choose k in advance, just cut the tree (dendrogram) at the level you want.
Where it’s used:
- Gene expression clustering
- Social network analysis
- Document or topic grouping
- Any case where interpretability matters
Where it struggles:
- Not scalable to large datasets
- Sensitive to distance metrics and linkage methods
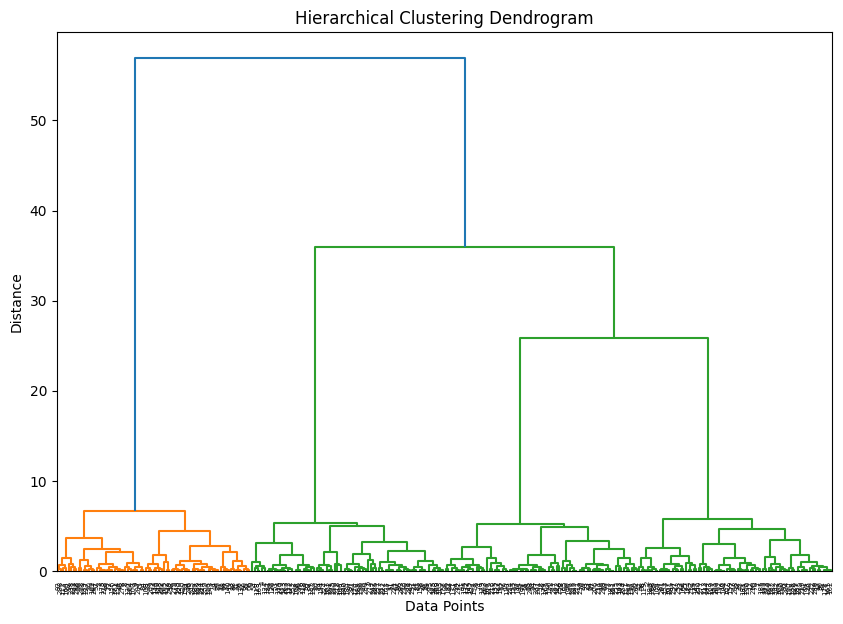
Hierarchical Clustering in Python
from scipy.cluster.hierarchy import dendrogram, linkage
from sklearn.datasets import make_blobs
from matplotlib import pyplot as plt

X, _ = make_blobs(n_samples=300, centers=4, cluster_std=0.60, random_state=0)
linked = linkage(X, 'ward')

plt.figure(figsize=(10, 7))
dendrogram(linked)
plt.title("Hierarchical Clustering Dendrogram")
plt.xlabel("Data Points")
plt.ylabel("Distance")
plt.show()
10.4 Key Takeaways
- Unsupervised learning finds structure in data without labeled outcomes.
- K-Means partitions data into fixed groups based on minimizing distance to cluster centers.
- Hierarchical clustering builds a tree of clusters, offering flexibility and interpretability.
- Both methods have strengths depending on your data and your goal: exploration, segmentation, or simplification.